Measure success with Power BI: 9 ideas for custom fleet reports
Measure success with Power BI: 9 ideas for custom fleet reports
Power BI makes it easy to bring your data together in one place. Access, prep, and model real-time data to create custom reports and help yourself to business insights.
You’ll be able to consolidate key metrics using interactive dashboards and generate rich reports that connect data sets. Power BI currently supports more than 70 connectors, allowing you to load data from local and cloud-based sources including Azure, DropBox, Google Analytics, OneDrive, and SalesForce. Power BI also integrates seamlessly with Excel, eliminating the need to export files and making it extremely easy for MS Excel users to pick up. Just click on “Analyse in Excel” and you’ll get a virtually identical interface.
But don’t let the interface fool you. While Excel starts to get bogged down when dealing with large data sets, high-performance Power BI can handle tables in excess of 100 million records, no problem. Power BI also refreshes automatically between one and eight times a day – you decide how often and when – ensuring your data is always up to date for efficient reporting and more accurate insights.
EROAD Analyst for Power BI
EROAD Analyst is our integration that connects to Power BI, allowing you to pull six months of historical EROAD data into Power BI instantly and easily. Users of MyEROAD can access location, logbook, and fuel data and use drag-and-drop functionality to build their own reports. They can also get answers to specific questions they may have about their fleet using natural-language queries, e.g., “What is my cost per K?” As you type, Power BI will suggest related queries and generate a preview of a chart or table that best represents the data you’re looking for.
But with so many integrations available, where and how do you begin? What sort of fleet data might you want to connect and how could it change your business? Maybe you want to track your progress on achieving KPI targets, for example, a 50% reduction in overspeeds or costs. Or you could measure fleet utilisation by comparing actual work done against planned work.
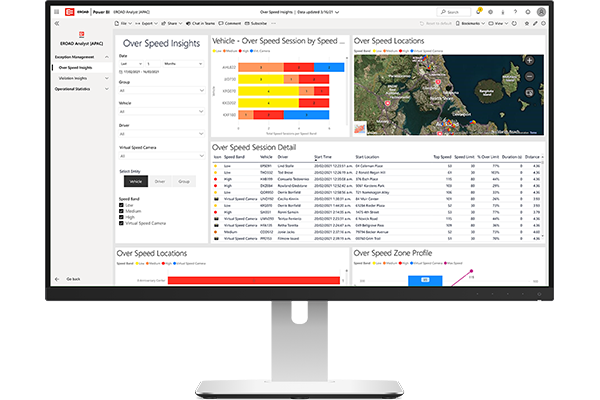
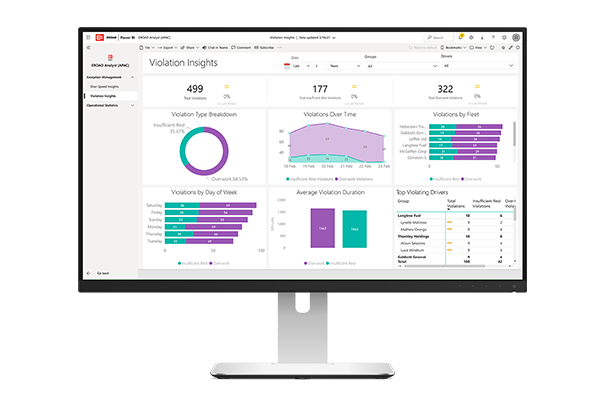
Reports you can create using EROAD Analyst
For those of you just getting your feet wet, we’ve come up with some use cases you may wish to explore:
Other than the six-month cap on data history, the only limit is your creativity! And if you have your own analytics team and data warehousing solution, you could even opt to access all your data using Snowflake.
Need help? EROAD partners with a consultant who can provide customer training and/or develop products for you, if needed. To learn more, contact our sales team.
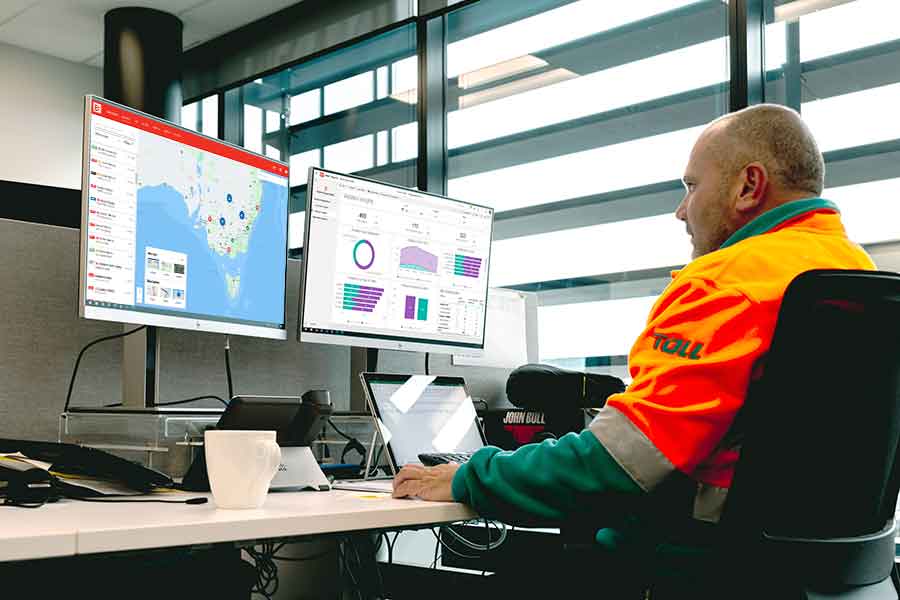
“We can mix and match and feed it into our Power BI system to generate productivity reports. We can also confidently integrate our data to get true productivity measures. We can identify our non-performers and our top performers to determine who might need extra support and coaching.”
Allen Winton,
National Transport Manager, Toll New Zealand