Fleet Management – EROAD Fleet Utilisation Dashboard
EROAD Fleet Utilisation Dashboard helps you maximise usage of your fleet and auxiliary devices based on your company’s utilisation targets. You’ll be able to easily identify opportunities to balance the workload across your fleet, and gain insights into how and where to optimise your fleet size and make-up.
Optimising Your Fleet’s Profitability
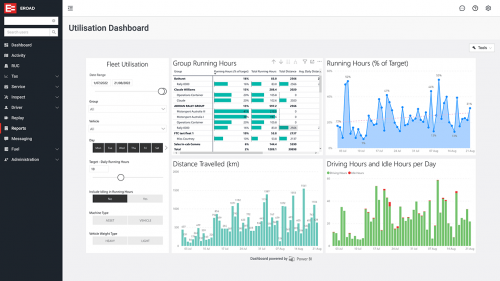
It’s no easy task to get a clear picture of how well your organisation’s vehicles are utilised. You can walk around the yard, talk to your dispatchers or spend hours manipulating spreadsheets – and still not have all the information you need.Our Fleet Utilisation Dashboard delivers valuable insights into your fleet and auxiliary devices at a glance – allowing you to monitor utilisation against your company’s targets. Being able to see key utilisation metrics will allow you to balance the workload and determine how and where to optimise your fleet.
Graphs make it easy to assess utilisation trends for distance travelled and running hours so you can ensure they are in line with expectations. Where you need to investigate fleets or vehicles you can drill down to quickly view more data and better understand the full picture and whether you need to take action.
Key Benefits
Right-size your fleet
Make informed decisions about when to divest, expand or redeploy vehicles and assets to improve profitability
Improve cost-to-revenue ratio
Measure distance travelled over time to support fleet optimisation and ensure only the necessary miles are travelled to deliver your business’s goods or services

Maximise asset utilisation
Compare engine running hours with auxiliary equipment usage to ensure you’re making the most of your assets
Key Features
Monitor fleet and vehicle utilisation against a custom set target
Drilldown to fleets and vehicles which fall below the optimum utilisation target; view additional data for a more in depth investigation
View distance travelled and utilisation trends to get insight into fleet performance over time
View the time that auxiliary equipment has been active in comparison with running hours of the asset – for productivity analysis
PDF and CSV export available for regular scheduling – so reports can be delivered to your mailbox for quick daily, weekly or monthly review
Find out more: